For many years, speculators in the financial markets such as the stock markets, or the foreign exchange markets, had relied heavily on fundamental forces to make informed trading decisions.
However, research began to prove that these fundamental/economic forces are not the only factors driving the markets, but that emotions also known as mass psychology of the traders, have had a significant role to play in it.
Fundamental Analysis had been the basis for speculating the global market because the instruments being traded are in one way or the other connected to real assets such as gold, foreign exchange(fiat), stock index, etc. Hence, you cannot make any decision without considering the economic factors affecting their prices.
Now, since human emotions also drive the market at least in the short-term, there arises a need for an asset that could be speculated without the need to factor in those economic factors. An asset that can be traded by only analyzing artificial metrics, saving the headache of economic upheaval, and that ushered us into the age of Synthetic instruments.
There are diverse kinds of synthetic instruments but our major focus is on the Synthetic Volatility Indices. Now, what are Volatility Indices? We’ll find out shortly.

We cannot understand the meaning of Volatility Indices without first demystifying the term Index. Simply put, an Index(Stock Market Index) is a financial asset specifically designed to track the ups and downs of a chosen group of stocks or other assets.
Hence, by simply looking at the performance of a market index, you can get a bird’s eye view of certain select market stocks, thereby aiding you to gauge the health of that section of the stock market, thereby gauging the performance of your investments. Indices like the NAS 100 Index, SP 500 Index, etc are among the diverse stock indices that measure different sections of the stock market.
The term Volatility Index(VIX) was coined by the Chicago Board Options Exchange, and it is called the CBEO VIX. It was initially created to track or measure the market’s expectation of the implied volatility of the S&P 100® Index options prices over a 30-day period. Later, the CBEO teamed up with Goldman Sachs and updated the VIX Index to measure the expected volatility of the SP 500 index.
This SP 500 index also tracks the performance of the best performing 500 companies in the united states at any given time. It’s widely used by investors, risk managers, hedge funds, and big banks to make their informed decisions.
Synthetic Indices are traded as CFDs. So, before we dive in further, Let’s understand what a CFD is about. Contract For Difference(CFD) is a contract between two parties(a buyer and a seller). The contract is made in such a way that the buyer must pay the seller the difference between the current value of an asset and its value at the expiration of the contract.
This type of contracts enables speculators to place orders from the price movements of an asset without practically owning the underlying asset.
In layman’s terms, a CFD enables a buyer and a seller to make profits or takes losses from the price movement of financial assets without having to take owner of the full asset. For instance, an asset ABC is currently trading at $75, now say a buyer predicts that the asset will move to $80 in a future date. The order will be executed as CFD. So, if the asset eventually moves to $80, the buyer will take the difference which is $5 as his profit, However, if the asset moves the opposite direction, say it closed out at $70, the buyer will take the difference of $5 as his loss, while the seller has gained $5. And the contract is terminated until another one is engaged.
Synthetic Indices are simulated Indices. They simply mimic the price behaviour or characteristics of the original Indices such as the CBEO VIX, SP 500 Index, etc.
Moreover, as its name implies, Synthetic Indices are artificial Indices, meaning that, if the original Indices such as the VIX is used to track the performance of the SP 500 Index, and the SP 500 Index in turn measures the performance of the fortune 500 companies in the United States, then, an artificial Index such as this is literally measuring or tracking nothing.
Real Indices track the performance of a given section of the stock market, artificial indices or synthetic indices also exhibit the behavior of the real indices, behaviours such as a crash in market prices. However, unlike the real indexes(The CBEO VIX or the S&P 500 Index), they don’t track or measure anything.
Their prices are synthetically(artificially) generated by some set of computer algorithms. Hence, we can say that they are simulated markets: they simply mirror or mimic the price movement of these real indices. They are traded as financial derivatives(CFDs).
Unlike the original Indices, They derive their value from market sentiment which is the mass psychology that I talked about earlier. The simplest way to understand this concept to think as synthetic assets like a piece of computer software. This software was designed to solve a problem and in this case to make money for people, but where will the money come from? If you said the people then you’re 100 percent right, the money will come from no other place but from the people. Now, as money people hear of this computer software and of how it will make them rich, they will rush in to take their own share and the money the invest on this computer program, the higher the price of the asset hence the higher the value. However, if the people at any time decides that over this asset is been over-valued or that the price may soon crash, they may sell their shares on the asset, causing it’s price to go down. This is also the behaviour of the original Indices, their prices are sometimes also driven by these market sentiments and not just the fundamental forces.
Most traders are often confused with the term synthetic indices and volatility indices. Is there any difference? We are about to find out.

Synthetic Indices and Volatility Indices are often used interchangeably but literally, they’re not exactly the same. As I mentioned earlier, the CBEO VIX is a real instrument, meaning that it has a correlation with tangible assets, but synthetic Indices are simply mirroring the behaviour of the real volatility index. Moreover, the volatility Index is the only synthetic Index that has been designed.
The Implication is that apart from the Volatility Index, there exist other artificial assets like the Boom and Crash Indices, the Range Indices, etc. It’s likely that you may not fully understand why or how these instruments but I want you to be rest assured that their meanings are not far from their names. Let’s find out how they got these names.
Among the first brokers to offer the synthetic Indices is the financial Exchange Deriv hence the examples that I’ll be using here reflects the synthetics Indices offered on their platform. In the early days of these synthetic assets, there was just a handle of them with the Volatility 75 Index being the most popular, but due to the need for traders to diversify their portfolios, more assets were created.
There are five categories of synthetic Indices, they are the Volatility Indices, The Crash Boom Indices, the Range Indices, the Jump Indices, and the Step Index.
These Indices not at all correlated to one another. Even among the ones in the same category behave differently, so be rest assured that when you open orders in any of them that you’re trading a completely different asset.
Volatility Indices
Volatility 10 Index
Volatility 25 Index
Volatility 50 Index
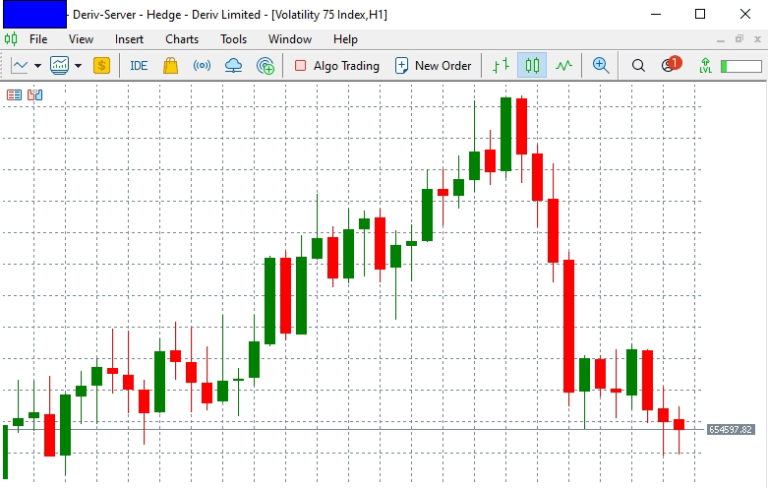
Volatility 75 Index
Volatility 100 Index
Volatility 10(1s) Index
Volatility 25(1s) Index
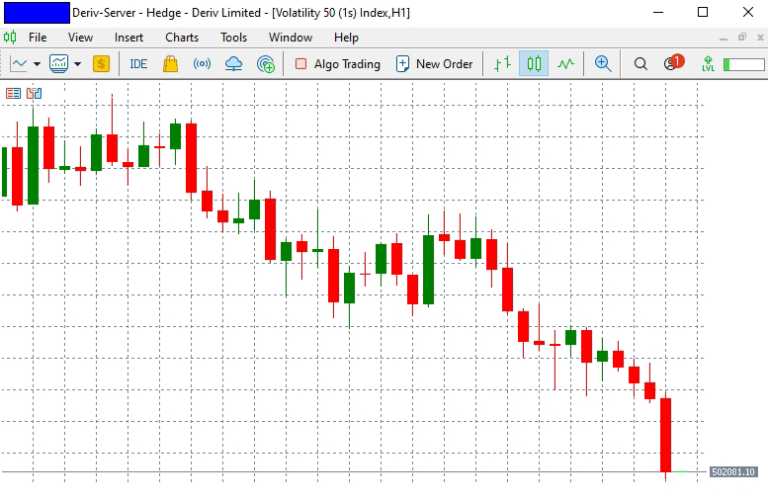
Volatility 50(1s) Index
Volatility 75(1s) Index
Volatility 100(1s) Index
Volatility 200(1s) Index
Volatility 300(1s) Index
Crash Boom Indices
Crash 300 Index
Boom 300 Index
Crash 500 Index
Boom 500 Index
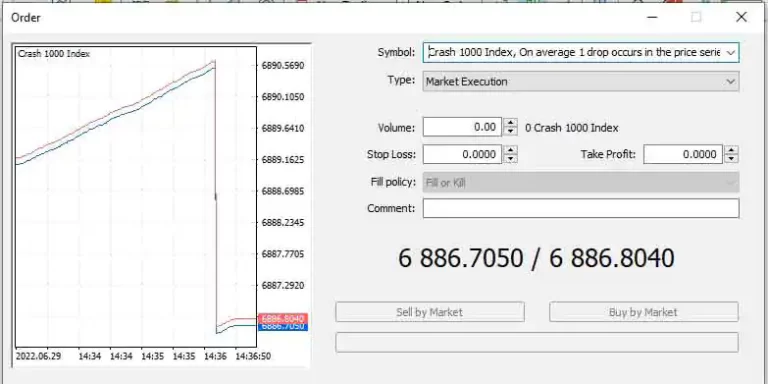
Crash 1000 Index
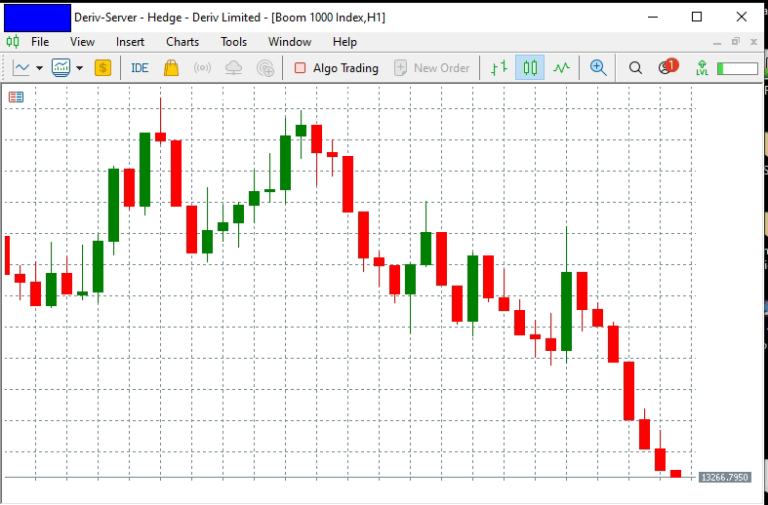
Boom 1000 Index
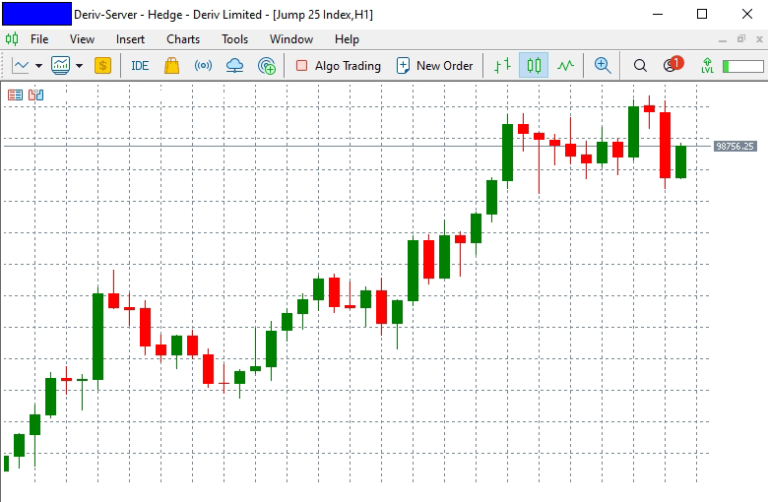
Jump Indices
Jump 10 Index
Jump 25 Index
Jump 50 Index
Jump 75 Index
Jump 100 Index
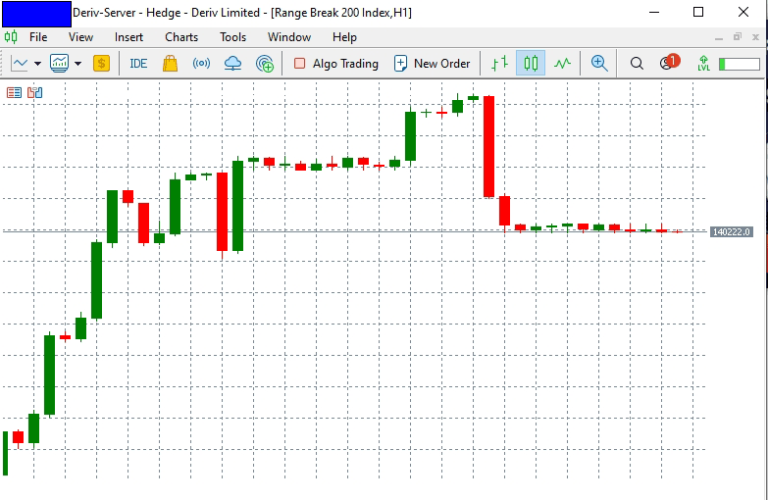
Range Break Indices
Range Break 100 Index
Range Break 200 Index
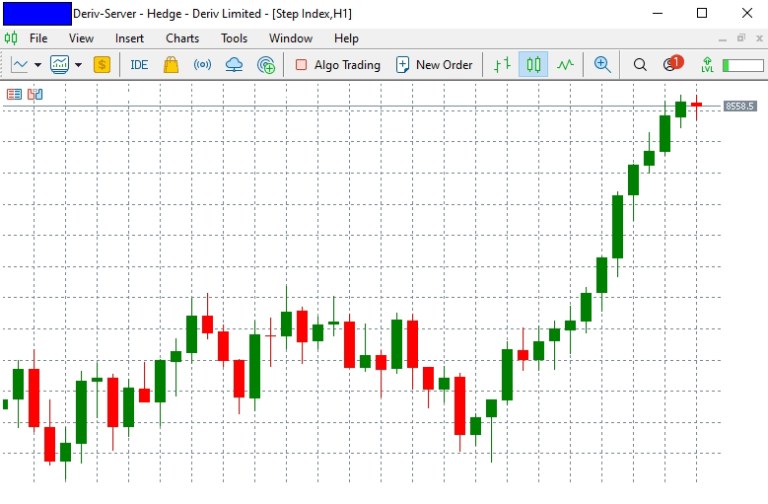
Step Index
Step Index
On October 29th, 1929, the most devastating market crash in the history of the stock markets hit the US stock markets. It was so bad that it was nicknamed “The Black Tuesday.” You may be wondering what a market crash which happened in 1929 has got to do with Synthetic Indices right? Well, before the crash on the 29th, there was a huge sell-off on the 24th which was a Thursday.
We have had such several crashes throughout the history of the stock market, the most recent one being the market crash of 2008. The financial markets has always had this characteristic crashes from time to time. A market crash could be as a result of a natural disaster, war, change in economic policy of super-power countries, etc.
On the other hand, during periods of plenty, or sustainable economic growth of a country or the stock markets, the market can be said to be booming, however, negative events such as wars can also trigger a market boom, a good example is the current Russo-Ukrainian war which had sky-rocked the cost of food prizes globally. It’s a boom boom because some other food producing countries are taking advantage of the situation to make great profits. So far the prizes of an asset is experiencing some sudden spike, we can say that it’s booming.
So, as you might have rightly guessed, the Crash Index got it’s odd name from market crashes such as the one that occurred in 1929, 2008 and so on. The numbers 300, 500, and 1000 represents the number of average ticks the instruments reaches before sudden drop in price(Crash). This means that Crash 300 crashes after every 300 ticks on average, likewise Crash 500 which crashes after every 500 ticks and so on.
The Boom Index is almost like the Crash Index but instead of a price crash, what we are seeing is a spike, they exhibit almost the same behaviour but in the opposite direction. Hence, like the Crash Index, Boom 500 spikes once after every 500 ticks at an average, while the rest follow the same patterns like the Crash index.
The Volatility Indices got their names from the CBEO Volatility Index. Though these Instruments cannot be traded just by monitoring the original CBEO VIX, but the numbers that succeeds the Index indicates how much the Instruments different from the actual CBEO VIX.
So, VIX 10 can be said to mimic the movement of the CBEO VIX at a speed of 10 percent, while VIX 25 mimics 25 percent. The most popular Synthetic Indices being the VIX 75 index has volatility of 75 percent of the original asset, likewise VIX 100 which has 100 percent Volatility.
The Volatility(1s) Index which means Volatility One tick per second Index also follow mimics the original VIX according to their numbers but in this case, it makes it movement at one tick per second. This means that VIX 10(1s) Index designed to make a 10 percent movement of the original VIX at the speed of one tick per second. Likewise the rest of the VIX(1s) Indices.
The market does not always boom or crash, there are times when it enters into a period of consolidation, this period is popularly referred to as a Market Range. hence Range Break indices mimics those periods in the market when market ranges for some time and suddenly breaks out of the range and begins to trend. As you might have already guessed, Range Break 100 Index break the range after every 100 ticks on average, likewise the range 200 index.
The Jump Index makes 3 jumps on average every hour and just like the Volatility Index it’s percentage Volatility is dependent on the number behind it. So, Jump 10 Index has a 10 percent Volatility and makes an average of 3 jumps per hour, in the same vein, Jump 25 has a 25 percent Volatility with an average of 3 jumps per hour. You can deduce the rest.
The last but not least is the Step Index, this index is just a pure synthetic Index, it’s not actually mirroring any volatility. It only makes a up and down movement with an equal probability with a step of 0.1.
Going forward, I will show how to trade these assets and make good returns on your investment using…
When I was introduced to Synthetic Indices in 2019, I was elated. I thought to myself, this is the best thing that has happened to me. It was like a dream come true. The trading time of the assets is 24/7, so I had no worry about market closing time like in the FX market. Then the fact that I don’t have to check the FX calendar before placing a trade, took my joy to a whole new level.
So, i just into the bandwagon, Withdraw some money from my crypto account and deposit so that I will hit it real big. Unfortunately, what happened next is history. I lost almost of my deposits, It’s not because I don’t know how to trade but because the instruments are a relatively new asset when compared to FX or the stock assets. I was too excited and I paid dearly for my mistakes. I didn’t create this site to paint a perfect picture of trading to you my dear reader. I’m here to tell you the truth and nothing but the truth.
Synthetic Indices Synergy is the answer and solution that I discovered along the way in my trading journey. As the name literally implies, Synthetic Indices Synergy is a trading philosophy that integrates several tested and proven trading systems that can be used as a blue print to effective long term trading career.
I took my time to go into detail what it takes to plan and execute trades that bring consistent return on investment in the long term. As you may already know, success in trading doesn’t happen over night. It takes time. If you want to get rich over time, don’t ever come close to trading CFDs, be invariably you must fail.
Take your time, don’t rush into trades, the faster you rush to execute order the faster your account will go down. What you should get is Knowledge because that is what will pay you the highest dividend.
Learn to trade the right way.